CDC estimates that, from October 1, 2019, through January 11, 2020, there have been:
13,000,000 – 18,000,000
flu illnesses

5,900,000 – 8,500,000
flu medical visits

120,000 – 210,000
flu hospitalizations

6,600 – 17,000
flu deaths

*These estimates are preliminary and based on data from CDC’s weekly influenza surveillance reports summarizing key influenza activity indicators.
Preliminary Cumulative Estimates of Hospitalizations in the U.S. 2019-2020 Flu Season
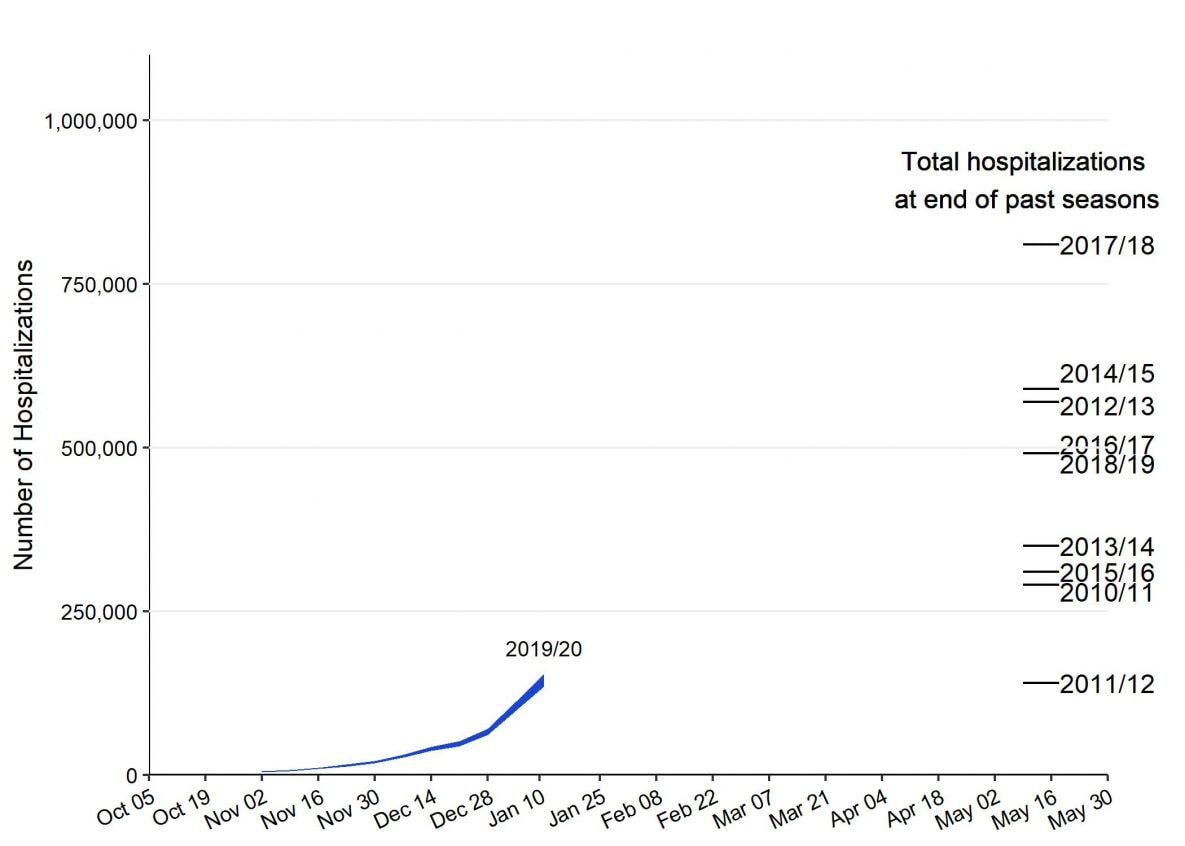
*These estimates are preliminary and based on data from CDC’s weekly influenza surveillance reports summarizing key influenza activity indicators.
Estimated number of influenza-associated hospitalizations
The y-axis extends from 0 to 1 million.
The x-axis is a timeline starting October 5, 2019 and extending to May 30, 2020.
There is a single blue-shaded curve labeled with “2019/20”.
There are several other lines on the right side of the graph under Total hospitalizations at end of past seasons. The lines are labeled, from top to bottom, as 2018/19, 2017/18, 2014/15, 2016/17, 2012/13, 2013/14, 2015/16, 2010/11, and 2011/12 and represent the estimated burden for these seasons. This allows for the comparison of the current season to past seasons.
from
https://www.cdc.gov/flu/about/burden/preliminary-in-season-estimates.htm?from=groupmessage&isappinstalled=0
 创作新主题
创作新主题